Stock Charting
Advertisement
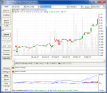
System Fibonacci v.2.0.0.7
Now you can have your own stock charting analysis tool: System Fibonacci. With System Fibonacci you can create excellent looking charts.
Advertisement
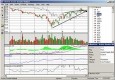
FCharts 1.5.95h v.1.0
FCharts SE is a free stock charting program which will import price data from a wide range of sources, displaying it as OHLC, Candlestick and Line charts. It has a number of built-in indicators (MACD, RSI, Exponential and Standard Moving Averages),
TekView Explorer v.1.0
TekView Explorer is a stock charting and technical analysis tool designed to assist traders become more proficient through practice and testing. It provides an easy-to-use interface the supports multiple views, overlays and indicator charts.
Equity Rider Standard Edition v.2.0
EquityRider is an advanced stock charting and trading systems analysis software for many markets: stocks, forex, and futures. It allows you to create custom indicators, derive indicators based on standard ones,
MacStockManager v.2.5
MacStockManager provides stock portfolio management, live quotes, and stock charting including 16 modifiable technical indicators.
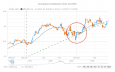
AnyStock Stock and Financial JS Charts v.8.7.0
AnyStock Stock and Financial JS Charts is a flexible JavaScript charting library to visualizing large data sets in interactive HTML5 charts. Designed to display date/time information it offers various chart types, drawing tools, technical indicators.
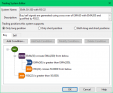
Stock Quotes Pro v.1.40
Stock Quotes Pro is a utility utility that instantly downloads end-of-day historical quotes of stocks, indices and mutual funds publicly traded in US, Canada and international markets.
Financial Charting Component
Financial Charting Component (standard edition) is written in 100 percent C sharp with cutting edge .NET technology. In addition to its striking visual effects, it has a variety of features including charts with pan and zooming charting features: Point
StockAnalyzer v.3 9
All in one stock research solution, customizable and easy to use, save you time & money doing stock research online.
Stockalyze v.2024.2.8.84
Start using Stockalyze just after installation. Technical analysis of stocks from more than 50 stock exchanges are supported. Stockalyze LITE is completely free, just that few advanced features are available for evaluation purpose only.
Bull's-Eye Broker v.4.0.0108
Bull's-Eye Broker is an advanced software package which constructs and maintains stock market Point & Figure Charts.